http://kb.tableau.com/articles/knowledgebase/create-quadrant-chart
Dynamic Reference Lines and Colors in Scatter Plots
http://www.thedataschool.co.uk/pablo-saenz-de-tejada-2-2-2-2-2-2-2-2-2-2-2-2/dynamic-reference-lines-and-colors-in-scatter-plots/

Tuesday, 7 June 2016
Monday, 6 June 2016
Asterisks Display in Tooltips - Tableau Desktop

http://kb.tableau.com/articles/Issue/asterisks-display-in-tooltip?userSource=1
https://community.tableau.com/thread/153244?start=30&tstart=0
Problem: I was
able to display the multiples time in a single row, but as tooltip it is
duplicating the values
Feeder (Table across)
used:
IF first()==0 THEN
STR(min([Start
Timestamp]))ELSE
PREVIOUS_VALUE("") + ", " + STR(min([Start Timestamp]))
END
Date tooltip (Table across) used:
IF FIRST()==0 THEN
LOOKUP([Feeder],LAST())END
Table Calculation Functions
Filter Actions
Connecting Active Directory as Tableau data source
The ability to connect with Active Directory as a data source is not currently built into Tableau desktop.
The best practice to get
around this issue is to mirror the unsupported data source onto a support data
source, so you can place the data you want to analyze in a form that Tableau
Desktop can properly connect with. The article below goes into more detail on
this issue and using an ODBC connection:
'Connections to Unsupported Data Sources'
'Ideas'
LDAP (OLE DB/ADO) data connector for analytics
Friday, 3 June 2016
Viz with data from Google Analytics
https://public.tableau.com/profile/nomie#!/vizhome/Q1-GoogleAnalytics-Analysis/Sheet3
https://public.tableau.com/views/DigitalAnalytics/ReferralSourceTypes?%3Aembed=y&%3AshowVizHome=no

http://vizwiz.blogspot.ca/2014_12_01_archive.html
 http://dataremixed.com/2013/08/how-to-view-your-website-stats-in-tableau/
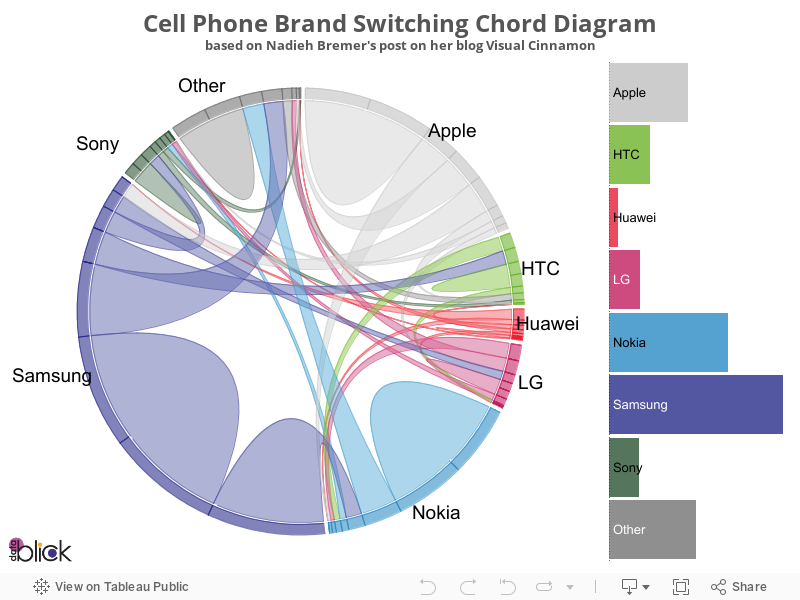
Chord Diagram in Tableau
Subscribe to:
Posts (Atom)