Tuesday 31 May 2016

Swapping views by categories (parameters) - Filtering a view according to a category selection (filter)

filtering a view according to a category selection:


Option 1- Using Filter Shelf Selection


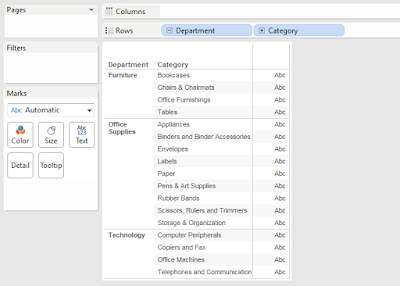
1. Locate the field that the view would be filtered by, in this case it would be Category 2. Drag this field, Category, onto the Filter Shelf 3. Right-click the field in the Filter Shelf and select "Show Filter"

4. Select the number of Categories that will affect the view 5. If desired the selection box can be formatted to show different selection methods by right-clicking the box


Option 2- Using a Parameter


1. Create a new Parameter

2. Select String for Data type

3. Select List

4. From 'Add from Field'  select the desired field, in this case Category 5. Select Ok 5. Drag the field selected above, Category, onto the Filter Shelf 6. Select Use all on the General Tab 7. Move to the Condition Tab 8. Select 'By formula' and type the following


[Category]=[Parameter Created Above]


9. Click ok

10. Right-click the parameter from the left hand pane and select 'Show Parameter'


Using any of the two options above will allow for the selection of a category to filter the current view. Please see the following articles for further information on filtering a view:


Show Filters in the View


Changing Views Using Parameters


Filters Shelf


Wednesday 25 May 2016

Common Pitfalls of the Google Analytics Connection with Tableau

Here are some Common Pitfalls that Dorcas Alexander highlights:

Pitfall #1:

The GA connector is bound by the limits of the Google Analytics API, which means you can’t ask for more than 10,000 rows of data at a time.

Pitfall #2:

If you ask for any segment of data that GA has to calculate by searching through a really large set (500,000 sessions or more), Tableau doesn’t warn you when it returns incomplete or inaccurate, sampled data.

Pitfall #3:

You can’t use “filters” in the Google Analytics sense, at least not to reduce the volume of data in your request.

Pitfall #4:

If you ask for too many dimensions, you may get sampled data. Google Analytics pre-aggregates certain combinations of dimensions and metrics, to produce the default set of tables also called “standard reports”. If you ask for a combination of dimensions that was not already calculated, GA has to create a brand new table. Same as with segments!

Sample of Tableau dashboard connected with Google Analytics


Google Analytics Key metrics - variable definition

It is easier to build a Viz if you can understanding the data from Google Analytics, and how the key metrics are created. 


KPIs
 
Acquisition – how visitors arrive at your website
  • Sessions
  • % New Sessions
  • New Users
Behavior – how visitors interacted with your website
  • Bounce Rate
  • Pages/Sessions
  • Avg. Session Duration
 
Conversions – how visitors completed conversions on your website.
  • Goal Conversion Rate
  • Goal Completions
  • Goal Value


https://www.epa.gov/sites/production/files/documents/glossary_of_metrics_used_in_google_analytics.pdf

Others KPIs are:
# of Visitors or Unique Visitors
# Page views
what Content
Bounce Rate
Traffic Sources: Referrals and Search
Average Time On Site
Mobile Performance
Keyword Analysis

http://www.cuutio.com/blog/2013/07/10/key-metrics-google-analytics/

https://blog.kissmetrics.com/expert-google-analytics-reports/

https://www.boxuk.com/insight/blog-posts/understanding-google-analytics-definitions-of-key-terms

http://www.analyticsmarket.com/blog/google-analytics-definitions

Connecting to Google Analytics - Tableau


The connection to Google Analytics is pretty straightforward.

It generate an EXTRACT.
For each analisis, it will be available 7 dimensions (discreate) and 10 measures (Continuous)

Geographical data such as city, country will automatically have latitude and longitude available as measures


Tuesday 24 May 2016

Removing "Abc" Placeholder Text

http://kb.tableau.com/articles/knowledgebase/removing-abc-placeholders


Sometimes the ABC from the right of the view annoying me.  Tableau Techinical Support sent me the workaround. There are actually two potential ways to get rid of the ABC from the right side of the view, I prefer to use the "Blank"
 
Create a calculated field
Create a calculation that will act as an invisible placeholder field.
 
Step 1 
 Create Calculated Field.
 
Step 2 
In the Create Calculated Field dialog box, type the following:
  1. Give the calculated field a name as Blank.
  2. In the Formula text box, type two quotation (" ") marks with a space in between the quotation marks.
  3. When finished, click OK.
Step 3 
Place the calculated field on the Text shelf, and place another instance of the calculated field in the Columns shelf.

http://kb.tableau.com/articles/knowledgebase/removing-abc-placeholders

About Me

I started to use tableau about 1 year ago for some of my projects. I like to be challenged & creative when designing things. Since I am still a beginner/intermediate tableau user, I am keeping this blog as a source to record the "Tableau Workarounds" that I encounter.