Friday 24 June 2016

Embed google maps on tableau dashboard

Option # 1

Dashboard> Actions> hyperlink > http://maps.google.com/maps/?daddr=<AVG(Latitude)>,+<AVG(Longitude)>


Option #2 (need a HTML to embed the map)

1. get Google Maps APIs Key
https://console.developers.google.com/apis/library  then > https://console.developers.google.com/apis/api/maps_embed_backend/overview
  1. Visit the APIs Console at Google Developers Console and log in with your Google Account.
  2. Click the Services link from the left-hand menu.
  3. Activate the Google Maps Embed API service. (click on the button ENABLE)
  4. Add credentials: Key for browser apps.
  5. create a browser name and the key will be generated
  6. https://community.tableau.com/thread/164784?keywords=Google%20Maps%20Embed%20API%20must%20be%20used%20in%20an%20iframe

http://www.dataplusscience.com/EmbedGoogleMaps.html

Thursday 23 June 2016

Web Page Objects on Tableau Dashboards

http://www.clearlyandsimply.com/clearly_and_simply/2012/09/web-page-objects-on-tableau-dashboards.html

VIZ for GA data

http://talkdatatome.net/2014/05/27/plotting-two-different-time-series-on-the-same-line-graph-in-tableau/

Map controls tip

ControlsOld map control (Tableau 8.3 and prior)New map control (Tableau 9)


default controlselect points using Rectangular Selection toolpan on the map
Shift + Left Click (hold)pan on the mapsame
Control + Shift + Left Click (hold)zoom in with rectangle controlsame
Control + Shift + Alt + Left Click (hold)zoom out with rectangle controlsame


A (press)nothingSets control to Rectangular Selection
S (press)nothingSets control to Radial Selection
D (press)nothingSets control to Lasso Selection
Shift + A (press)nothingLocks control to Rectangular Selection
Shift + S (press)nothingLocks control to Radial Selection
Shift + D (press)nothingLocks control to Lasso Selection


http://www.dataplusscience.com/MapControlTips.html

Wednesday 22 June 2016

QGIS


1.menu de baixo trocar EPSG para WGS 84
2. calcular centroide - Select Polygon Centroids menu item Vector>Geometry Tools>Polygon Centroids e depois Export/Add Geometry (salva como novo shp)
 https://cmapsconnect.com/tutorial/getting-shapefile-centroids-center-point/#gsc.tab=0
3. menu layer >open table attribute p ver coordenadas
4. menu layer > save layer as file (csv)


Wednesday 15 June 2016

Converting Latitude/Longitude from Degrees/Minutes/Seconds to Decimal Degrees

http://kb.tableau.com/articles/knowledgebase/convert-latitude-longitude

Bend custom geocoding in Tableau


I press Ctrl + A to select all the marks on the map (or Area select them) and then right-click a mark and select “View Data”.
Now I have every zip code within a region along with the associated Latitude and Longitude.  Now, simply press Ctrl + A to select all rows, then Copy, then close the dialog box, then Ctrl + V to paste back into Tableau as a new data source!

http://vizpainter.com/poor-mans-custom-geocoding-in-tableau-part-2/

Data blending in Tableau


Tuesday 14 June 2016

Create parameter to change level of geographical level


http://vizpainter.com/another-tableau-mapping-tip-geographic-drill-down-to-lower-levels-of-detail/

Overlap 2 different layers (filled and shape) in tableau


Create a dual-axis map.
  1. Add one level of the hierarchy (for example, states) to the view by double-clicking the field in the Dimension pane. This will add the generated Latitude and Longitude fields onto the Column and Rows shelf.
  2. Add an additional instance of Latitude (generated) to the Rows shelf.
  3. Add the other desired level of the hierarchy (for example, city) to the Marks card for the second Latitude (generated) field.
  4. On the Rows shelf, right-click on the second Latitude (generated) field and select Dual Axis.

Numeric field in seconds to HH:MM:SS

[field in seconds]/(60*60*24)

format > custom> hh:mm:ss

https://community.tableau.com/message/224840

Google Analytics Measures formulas in Tableau

http://kb.tableau.com/articles/knowledgebase/useful-ga-measures

Group Measures NameTableau FormulaVersion
AdSenseAdSense CTR[AdSense Ads Clicks]/[AdSense Page Impressions]8.2 and later
AdSenseAdSense eCPM[AdSense Revenue]/[AdSense Page Impressions]*0.0018.2 and later
AdWordsCPM[Cost] / ([Impressions] / 1000)8.0 and later
AdWordsCPC [Cost] / [Clicks]8.0 and later
AdWordsCTR[Clicks] / [Impressions]8.0 and later
AdWordsCost per Transaction [Cost] / [Transactions]8.0 and later
AdWordsCost per Goal [Cost] / [Goal Completions]8.0 and later
AdWords Cost per Conversion[Cost] / ([Transactions] + [Goal Completions])8.0 and later
AdWordsRPC ([Revenue] + [Goal Value]) / [Clicks]8.0 and later
AdWordsROI([Revenue] + [Goal Value] - [Cost]) / [Cost]8.0 and later
AdWordsMargin ([Revenue] + [Goal Value] - [Cost]) / ([Revenue] + [Goal Value])8.0 and later
App TrackingScreens / Sessions[Screen Views]/[Visits]8.2
App TrackingScreens / Sessions[Screen Views]/[Sessions]8.2.1 and later
EcommerceEcommerce Conversion Rate[Transactions] / [Visits]8.0 – 8.2
EcommerceEcommerce Conversion Rate[Transactions] / [Sessions]8.2.1 and later
EcommerceAvg. Value [Revenue] / [Transactions]8.0 and later
Ecommerce Per Visit Value [Revenue] / [Visits]8.0 – 8.2
Ecommerce Per Session Value [Revenue] / [Sessions]8.2.1 and later
EcommerceTotal Value[Revenue] + [Goal Value]8.0 and later
EcommerceRevenue per Item[Product Revenue] / [Quantity]8.0 and later
EcommerceItems per Purchase [Quantity] / [Unique Purchases]8.0 and later
Event TrackingAvg. Value [Event Value] / [Total Events]8.0 and later
Event Tracking Events per Visit with Event[Total Events] / [Visits with Event]8.0 – 8.2
Event Tracking Events per Session with Event[Total Events] / [Sessions with Event]8.2.1 and later
ExceptionsExceptions / Screen[Exceptions]/[Screen Views]8.2 and later
ExceptionsCrashes / Screen[Fatal Exceptions]/[Screen Views]8.2 and later
Goal ConversionsPer Visit Goal Value [Goal Value] / [Visits]8.0 – 8.2
Goal ConversionsPer Session Goal Value [Goal Value] / [Sessions]8.2.1 and later
Goal ConversionsGoal Conversion Rate [Goal Completions] / [Visits]8.0 – 8.2
Goal ConversionsGoal Conversion Rate [Goal Completions] / [Sessions]8.2.1 and later
Goal Conversions Abandoned Funnels [Goal Starts] - [Goal Completions]8.0 and later
Goal ConversionsTotal Abandonment Rate ([Goal Starts] - [Goal Completions]) / [Goal Starts]8.0 and later
Internal SearchAvg. Search Results Views [Search Result Views] / [Total Unique Searches]8.0 and later
Internal Search % Visits with Search[Visits with Search] / [Visits]8.0 – 8.2
Internal Search % Sessions with Search[Sessions with Search] / [Sessions]8.2.1 and later
Internal SearchAvg. Search Depth[Search Depth] / [Total Unique Searches]8.0 and later
Internal SearchAvg. Search Duration [Time after Search] / [Total Unique Searches]8.0 and later
Internal Search % Search Exits [Search Exits] / [Total Unique Searches]8.0 and later
Internal Search Search Goal Conversion Rate [Goal Completions] / [Total Unique Searches]8.0 and later
Internal SearchGoal Value per Search [Goal Value] / [Total Unique Searches]8.0 and later
OtherApp Views per Visit [App Views] / [Visits]8.0 – 8.2
OtherApp Views per Session [App Views] / [Sessions]8.2.1 and later
OtherAvg. Visit Duration [Visit Duration] / [Visits]8.0 – 8.2
OtherAvg. Session Duration [Session Duration] / [Sessions]8.2.1 and later
OtherActions per Social Visit [Social Actions / [Unique Social Actions]8.0 – 8.2
OtherActions per Social Session [Social Actions / [Unique Social Actions]8.2.1 and later
OtherAvg. User Timing (sec) [User Timing (ms)] / [User Timing Sample]8.0 and later
Other % New Visits[New Visits] / [Visits]8.0 – 8.2
Other % New Sessions[New Sessions] / [Sessions]8.2.1 and later
Page Tracking Entrances/Pageviews [Entrances] / [Pageviews]8.0 and later
Page Tracking Entrance Bounce Rate [Bounces] / [Entrances]8.0 and later
Page TrackingBounce Rate [Bounces] / [Visits]8.0 – 8.2
Page TrackingBounce Rate [Bounces] / [Sessions]8.2.1 and later
Page Tracking Pages/Visit [Pageviews] / [Visits]8.0 – 8.2
Page Tracking Pages/Session [Pageviews] / [Sessions]8.2.1 and later
Page TrackingAvg. Time on Page [Time on Page] / ([Pageviews] - [Exits])8.0 and later
Page Tracking % Exit [Exits] / [Pageviews]8.0 and later
Page TrackingAvg. Page Load Time ([Page Load Time] / [Page Load Sample]) * 0.0018.0 and later
Site Speed Avg.Avg. Document Content Loaded Time (sec)([Document Content Loaded Time (ms)]/[DOM Latency Metrics Sample])*0.0018.2 and later
Site Speed Avg.Avg. Document Interactive Time (sec)([Document Interactive Time (ms)] / [DOM Latency Metrics Sample])*0.0018.2 and later
Site Speed Avg.Domain Lookup Time ([Domain Lookup Time] / [Speed Metrics Count]) * 0.0018.0 and later
Site Speed Avg.Page Download Time ([Page Download Time] / [Speed Metrics Count]) * 0.0018.0 and later
Site Speed Avg. Redirection Time ([Redirection Time] / [Speed Metrics Count]) * 0.0018.0 and later
Site Speed Avg.Server Connection Time ([Server Connection Time] / [Speed Metrics Count]) * 0.0018.0 and later
Site Speed Avg.Server Response Time ([Server Response Time] / [Speed Metrics Count]) * 0.0018.0 and later

Monday 13 June 2016

Custom Mapping (FSA)

http://public.tableau.com/views/CustomGeocoding/SalesDemographicsDashboard?:embed=y&:showVizHome=no&utm_medium=Website&utm_source=Unilytics&utm_campaign=Link+Cust+Dash+wp&utm_content=:&UC.cid=WUCDgeocode&WT.mc_id=WUCDgeocode

Blogs with great VIZ ideas

http://public.tableau.com/profile/ben.jones/#!/

Thursday 9 June 2016

Calculate time intervals (duration) within the same column in tableau


https://community.tableau.com/thread/156582?start=0&tstart=0

hh:mm:ss to seconds in Tableau

The DATEPART() function is used in the # of Seconds calc to extract the hours, minutes, and seconds to turn everything into seconds with the following formula:
 
DATEPART('hour',[Time DateTime]) * 3600 + DATEPART('minute',[Time DateTime])*60 + DATEPART('second',[Time DateTime])
 
Now there's a measure that can be used. To go from # of Seconds back to HH:MM:SS, here's a hh:mm:ss string calc with the following formula:
 
STR(INT(SUM( [# of Seconds] )/3600)) + ":" +
// convert minutes back to a string
IF LEN(STR(INT((SUM([# of Seconds]) % 3600 ) / 60))) = 1 THEN
    "0" + STR(INT((SUM([# of Seconds]) % 3600 ) / 60))
ELSE
    STR(INT((SUM([# of Seconds]) % 3600 ) / 60))
END
+ ":" +
//convert seconds back to a string
IF LEN(STR(INT(SUM([# of Seconds]) % 60))) = 1 THEN
    "0" + STR(INT(SUM([# of Seconds]) % 60))
ELSE
    STR(INT(SUM([# of Seconds]) % 60))
END


https://community.tableau.com/message/224840

Time durations - More/ less 24h

http://drawingwithnumbers.artisart.org/formatting-time-durations/

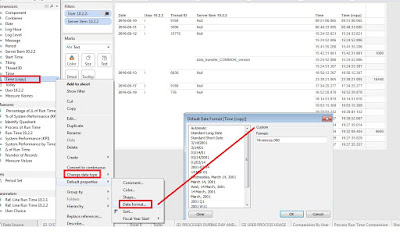
Transform string date to date format in Tableau


1. Duplicate the date dimesion (string)
2. Right click and "Change date type">>>> Date & Time  >> Ok
3. Right click and "Default Properties">>>> Date Format  >>  Custom >>> add "hh:mm:ss.000"

Wednesday 8 June 2016

Adding dynamic reference line for each separate member in a dimension


Step 1: Create the parameters

  1. Right-click in the Data pane and then select Create Parameter.
  2. In the Create Parameter dialog box, name the parameter "Furniture Goal".
  3. Under Data Type select Integer.
  4. Under Allowable values select All.
  5. Click OK.
  6. Right-click the parameter and then select Show Parameter Control.
  7. Complete Steps 1 through 6 for a parameter named "Office Supplies Goal".
  8. Complete Steps 1 through 6 for a parameter named "Technology Goal".

Step 32 Create the calculated field

  1. Select Analysis > Create Calculated Field.
  2. In the Create Calculated Field dialog box, name the field "Reference Line".
  3. In the formula field, enter the following formula:
CASE MIN([Department])
WHEN 'Furniture' THEN MIN([Furniture Goal])
WHEN 'Office Supplies' THEN MIN([Office Supplies Goal])
WHEN 'Technology' THEN MIN([Technology Goal])
END
  1. Click OK.


http://kb.tableau.com/articles/howto/adding-separate-dynamic-reference-lines-for-each-dimension-member

Choose parameter for x and y axis - Correlation in Tableau

https://community.tableau.com/thread/203822

Monday 6 June 2016

Asterisks Display in Tooltips - Tableau Desktop


http://kb.tableau.com/articles/Issue/asterisks-display-in-tooltip?userSource=1

https://community.tableau.com/thread/153244?start=30&tstart=0

Problem:  I was able to display the multiples time in a single row, but as tooltip it is duplicating the values
Feeder (Table across)  used:

IF first()==0 THEN
    STR(min([Start Timestamp]))
ELSE
    PREVIOUS_VALUE("") + ", " + STR(min([Start Timestamp]))
END

Date tooltip (Table across) used:

IF FIRST()==0 THEN
    LOOKUP([Feeder],LAST())
END

 Listed below are articles for reference on Addressing and Partitioning, the Table Calculation Functions used in the solution, and information on Dashboard Action Filters:

 Addressing and Partitioning


Table Calculation Functions


Filter Actions

Connecting Active Directory as Tableau data source

The ability to connect with Active Directory as a data source is not currently built into Tableau desktop.
 
 The best practice to get around this issue is to mirror the unsupported data source onto a support data source, so you can place the data you want to analyze in a form that Tableau Desktop can properly connect with. The article below goes into more detail on this issue and using an ODBC connection:
 

'Connections to Unsupported Data Sources'


'Ideas'


LDAP (OLE DB/ADO) data connector for analytics


Friday 3 June 2016

Viz with data from Google Analytics

https://public.tableau.com/profile/nomie#!/vizhome/Q1-GoogleAnalytics-Analysis/Sheet3 https://public.tableau.com/views/DigitalAnalytics/ReferralSourceTypes?%3Aembed=y&%3AshowVizHome=no


http://vizwiz.blogspot.ca/2014_12_01_archive.html
http://dataremixed.com/2013/08/how-to-view-your-website-stats-in-tableau/

Chord Diagram in Tableau


http://datablick.com/2015/08/27/diy-chord-diagrams-in-tableau-by-noah-salvaterra/

Calculate difference in value based on two date parameters


https://community.tableau.com/message/326594#326594

Tableau and Cognos Integration


Tableau and Cognos Integration