Monday 31 October 2016
convert [year] column to date
convert [year] column from excel to date
DATEADD('year', INT([Year])-1900, #1900-01-01#)
https://community.tableau.com/message/235385
Friday 30 September 2016
Georeferrence vector in QGIS
1. get maps EPSG Projection 2953 - NAD83(CSRS) / New Brunswick Stereographic
3. create control points - https://www.youtube.com/watch?v=gU05Zh_0d7A
4. captura coordenadas e cria txt:
# linear transformation from xy local to latlong
# 4 maps corners defined
# UL NW
# UR NE
# LR SW
# LL SE
x1 y1sem referencia x1 y1real 1 2
x2 y2sem referencia x2 y2real 4 3
x3 y3sem referencia x3 y3real
x4 y4sem referencia x4 y4real
6. Processing>toolbox>advance interface>grass commands>vetor>v.transform.pointsfile
https://www.youtube.com/watch?v=XEaDKUajB5c
- ortophoto - http://geonb.maps.arcgis.com/apps/SimpleMapViewer/index.html?appid=b5fa25e45055433dbc2716dfecfd1b2b
- snb
3. create control points - https://www.youtube.com/watch?v=gU05Zh_0d7A
4. captura coordenadas e cria txt:
# linear transformation from xy local to latlong
# 4 maps corners defined
# UL NW
# UR NE
# LR SW
# LL SE
x1 y1sem referencia x1 y1real 1 2
x2 y2sem referencia x2 y2real 4 3
x3 y3sem referencia x3 y3real
x4 y4sem referencia x4 y4real
6. Processing>toolbox>advance interface>grass commands>vetor>v.transform.pointsfile
https://www.youtube.com/watch?v=XEaDKUajB5c
Thursday 29 September 2016
Create Tableau Maps from Shapefiles
https://onlinehelp.tableau.com/current/pro/desktop/en-us/maps_shapefiles.html
Create Tableau polygons from shapefiles using QGIS
Before you follow the steps in this section, the coordinates in your shapefile should already be in the form of decimal latitude and longitude units, specifically using EPSG: 4326, WGS 84.Additionally, this procedure requires you to use QGIS Desktop, an open source GIS that supports many different shapefile formats.
Step 1: Download shapefile data
Step 2: Use QGIS Desktop to convert shapefiles to CSV file format
- Open QGIS Desktop.
- Select Plugins > Manage and Install Plugins.
- In the Plugins dialog box, do the following:
- In the search bar at the top, search for mmqgis.
- Select the
mmqgisplugin that appears, and click Install plugin.

- Click Close.
- On the left side of the workspace, click the Add Vector Layer icon.

- In the Add vector layer dialog box, do the following:
- Under Source type, click Directory.
- Under Source, click Browse, and then navigate to and select the US Counties folder.
- Click Open.
- If the Select vector layers to add dialog box appears, select cb_2015_us_county_500k, and then click OK. The polygons in the shapefile are plotted on the canvas and a layer is added to the Layers Panel.
- Select Vector > Geometry Tools > Multipart to Singleparts.
This breaks any multiple polygons in the shapefile into single polygons so that Tableau can read and plot them properly on a map view. If you skip this step, certain locations in your map view might not plot correctly because Tableau does not recognize that they might be separate polygons. For example, in the image below, some of the Wisconsin counties along Lake Superior are not plotted properly.

- In the Multipart to singleparts dialog box, do the following:
- For Input line or polygon vector layer, make sure US Counties cb_2015_us_county_500k any is selected.
- For Output shapefile, click Browse.
In the new dialog box that opens, name the file Single Polygons and save it on your computer. - Click OK, and then click Close to return to the QGIS workspace.
- Select MMGIS > Import/Export > Geometry Export to CSV File.
- In the Export Geometry to CSV dialog box, do the following:
- For Source Layer, make sure that Single Polygons is selected.
- For Output Nodes CSV File, click Browse.
In the subsequent dialog box that opens, name the file nodes.csv and save it to a location on your computer. - For Output Attributes CSV File, click Browse.
In the subsequent dialog box that opens, name the fileattributes.csvand save it in the same location that you saved thenodes.csvfile. - For Line Terminator, select LF. This ensures that any spaces are removed from cells in the CSV file.
- Click OK.


nodes.csv and attributes.csv, are saved to the location you chose.Step 3: Prepare the Nodes CSV file for Tableau
- Open the
nodes.csvfile you saved.
Note: The CSV file used in this example contains approximately 1,037,335 rows of data. Due to worksheet size limits, you might not be able to open this file in older versions of Microsoft Excel. - Add a new column called Path, which lists a sequence of numbers from 1 to however many records are in the file.
For this example, there are 1048575 records. For shortcuts on adding a sequence of numbers in Microsoft Excel, see the Microsoft Office Support website.

- Save and close the file.
Step 4: Connect to CSV files in Tableau and prepare your fields for creating map views
- Open Tableau Desktop.
- On the Connect section of the start page, click Text File.
- Select the nodes.csv file that you created with QGIS. The
- From the left pane, drag
attributes.csvto the top of the canvas, to the right of thenodes.csvfile.
Tableau creates an inner join between the two data sources because they have a field in common: Shapeid.

- In the grid on the bottom half of the workspace, click Update Now to view your data.
- In the grid, for the Shapeid (Attributes) and Shapeid columns, click the data type icon and select String.

Important: If you do not change both Shapeid columns to be string data types, the join between the two data sources breaks. - In the grid, for the X column, click the data type icon and select Geographic role > Longitude.
- For the Y column, click the data type icon and select Geographic role > Latitude.
- Click Sheet 1.
nodes.csv file is added to the top of the canvas on the data source page. If you saved the nodes.csv and attributes.csv files in the same place, they both appear in the left pane.
Step 5: Build the map view
- From the Measures pane, under nodes#csv, drag Shapeid(Count) and Path up to the Dimensions part of the Data pane.
This converts the two fields from measures to dimensions and ensures that Tableau treats these fields as discrete locations.

- From Measures, under nodes#csv, drag the X field to the Columns shelf, and the Y field to the Rows shelf.
Tableau adds an aggregation to each field on the Columns and Rows shelves and creates a map view with one mark.

- On the Marks card, click the Mark Type drop-down arrow and select Polygon.
This ensures that you can create a polygon map, instead of a point data map.

- From Dimensions, drag Shapeid to Detail on the Marks card.
The view temporarily updates to look like the following. Next, you tell Tableau where and in which order to plot each of the polygons.

- From Dimensions, drag the Path field to Path on the Marks card.
Note: If you do not see the Path option on the Marks card, check that the mark-type is set to Polygon, not Automatic or Filled Map. See step 3.The view updates to a legible map of the United States, with a separate polygon for every county. By adding the field Path, which is the column you manually created in thenodes.csvfile, you tell Tableau which order to draw the polygons on the map.

You can zoom in and out of the map view, adjust the color of the marks, and even customize the background map. You can also blend additional data, such as sales data, to one of the CSV files to perform additional analyses on your location data. For more information about blending geographic data, see Data Blending vs. Custom Geocoding.
Add point data from shapefiles using QGIS
You can also use QGIS Desktop to convert point data from shapefile to CSV file format, and then add that point data on a map in Tableau.Follow the steps below to learn how to use QGIS Desktop to convert shapefile data to text files and then use that data to create a point data map in Tableau. For information on how to download QGIS Desktop, see the Before you start section.
Step 1: Download shapefile data
- Go to the Natural Earth website and download the Airports data.
- Extract the shapefiles to a folder on your computer. In this example, the folder is named Airports and is saved on the Desktop.
Step 2: Use QGIS Desktop to convert shapefiles to CSV file format
- Open QGIS Desktop.
- On the left side of the workspace, click the Add Vector Layer icon.
- In the Add vector layer dialog box, do the following:
- Under Source type, click Directory.
- Under Source, click Browse, and then navigate to and select the airports folder.
- Click Open.

- In the Layers Panel, right-click the airports layer, then click Save As.
- In the Save vector layer as dialog box, do the following:
- For Format: Select Comma Separated Value.
- Click Browse to select the location where you want to save the file, and then click OK.
Step 3: Connect to the CSV file in Tableau and build the map view
- Open Tableau Desktop.
- On the Connect section of the start page, click Text File.
- Select the airports CSV file that you created with QGIS.
Theairports.csvfile is added to the top of the canvas on the Data Source page. - In the grid, for the X column, click the data type icon and select Geographic role > Longitude.

- For the Y column, click the data type icon and select Geographic role > Latitude.
- Click Sheet 1.
- On Measures, double-click the X (Longitude) and Y (Longitude) fields to add them to the Columns and Rows shelves.
A map with a single point appears. - From Dimensions, drag Name to Detail on the Marks card.
Every airport listed in the Name field is displayed as a point on the map because each airport corresponds to a latitudinal and longitudinal value.

Friday 15 July 2016
Friday 8 July 2016
Thursday 7 July 2016
Monday 4 July 2016
Tableau Resources - Mapping, charts, Tips
http://healthintelligence.drupalgardens.com/content/resources/tableau-training
Mapping in Tableau
- Fast and Fabulous Custom Maps using MapBox in Tableau - Anya | Datablick
- Create multiple custom map layers in MapBox that you can toggle on and off in Tableau - Anya | Datablick
- Creating Polygon-Shaded Maps - Knowledge base |Tableau
- Custom Geocoding Tableau for Belgium (and Luxembourg) - Nicolas Deruytter | Datatonic
- Hex Tile Maps in Tableau - Matt Chambers | SirVizAlot
- Box Tile Maps in Tableau - Brittany Fong | bfongdata
- How to Create Geospatial Heat Maps in Tableau with Altreryx - Chris Love | The Information Labs
- How to Embed a Google Map in Tableau - Ben Jones | DataRemixed
- How to Make Small Multiple Maps in Tableau - Ben Jones | DataRemixed
- How to Make Robinson Projection in Tableau - Ben Jones | Tableau Public blog
- How to Overlay Maps in Tableau - Olga Tsubiks | Olga's blog
- Cartograms in Tableau - Robert Mundigl | Clearly and Simply
- Bringing a Custom Map into Tableau in 10 Minutes or Less - Zack Gorman | Interworks
- How to Use ArcGIS Data, Features and Basemaps in Tableau - ArcGIS Resources
- 4-digit Postcode Map in Netherland in Tableau - Richard van Dijk | Infotopics
- Isolating Geographic Elements in Tableau - Stephanie Kennedy | Interworks
- The New Fabulous MapBox Studio Tutorial - Making a More accessible Map - Anya A'Hearn | Datablick
- How to Make (and Save!) a Custom MapBox Map in Your Viz - Anya A'Hearn | Datablick
- Mapping Using Quantiles - David Pires
- How to Create a Weather Map in Tableau - Cody Crouch | Interworks
- More Custom Map Tips for Tableau without Using Mapbox - Jeffrey Shaffer | Data + Science
- Manufactoring a polygon from a single lat/lon coordinate - Alan Eldridge | Databender
Mapbox and Tableau
- Fast and Fabulous Custom Maps using MapBox in Tableau - Anya | Datablick
- Create multiple custom map layers in MapBox that you can toggle on and off in Tableau - Anya | Datablick
- The New Fabulous MapBox Studio Tutorial - Making a More accessible Map - Anya A'Hearn | Datablick
- How to Make (and Save!) a Custom MapBox Map in Your Viz - Anya A'Hearn | Datablick
- Ultimate Mapping Guide Part 1: How Mapbox and Tableau Work Together - Chris Toomey | Tableauing Dangerously
- Ultimate Mapping Guide Part 2: Styling Mapbox Maps - Craig Bloodworth | The Information Lab
- Ultimate Mapping Guide Part 3: Bring Your Own Data - Chris Toomey | Tableauing Dangerously
- Ultimate Mapping Guide Part 4: Next Level Styles - Craig Bloodworth | The Information Lab
- Ultimate mapping Guide Part 5: Bringing It All Together - Chris Toomey | Tableauing Dangerously
Spatial Functions
- Calculating Distance - Tableau Software, Knowledge Base article
- Richard Leeke's Super-Charged Zip Radius-Finder - Tableau Community VizTalk
- Using Radius Filters on Maps - Tableau Software, Knowledge Base article
Friday 24 June 2016
Embed google maps on tableau dashboard
Option # 1
Dashboard> Actions> hyperlink > http://maps.google.com/maps/?daddr=<AVG(Latitude)>,+<AVG(Longitude)>
Option #2 (need a HTML to embed the map)
1. get Google Maps APIs Key
https://console.developers.google.com/apis/library then > https://console.developers.google.com/apis/api/maps_embed_backend/overview
http://www.dataplusscience.com/EmbedGoogleMaps.html
Dashboard> Actions> hyperlink > http://maps.google.com/maps/?daddr=<AVG(Latitude)>,+<AVG(Longitude)>
Option #2 (need a HTML to embed the map)
1. get Google Maps APIs Key
https://console.developers.google.com/apis/library then > https://console.developers.google.com/apis/api/maps_embed_backend/overview
- Visit the APIs Console at Google Developers Console and log in with your Google Account.
- Click the Services link from the left-hand menu.
- Activate the Google Maps Embed API service. (click on the button ENABLE)
- Add credentials: Key for browser apps.
- create a browser name and the key will be generated
- https://community.tableau.com/thread/164784?keywords=Google%20Maps%20Embed%20API%20must%20be%20used%20in%20an%20iframe
http://www.dataplusscience.com/EmbedGoogleMaps.html
Thursday 23 June 2016
Map controls tip
| Controls | Old map control (Tableau 8.3 and prior) | New map control (Tableau 9) |
| default control | select points using Rectangular Selection tool | pan on the map |
| Shift + Left Click (hold) | pan on the map | same |
| Control + Shift + Left Click (hold) | zoom in with rectangle control | same |
| Control + Shift + Alt + Left Click (hold) | zoom out with rectangle control | same |
| A (press) | nothing | Sets control to Rectangular Selection |
| S (press) | nothing | Sets control to Radial Selection |
| D (press) | nothing | Sets control to Lasso Selection |
| Shift + A (press) | nothing | Locks control to Rectangular Selection |
| Shift + S (press) | nothing | Locks control to Radial Selection |
| Shift + D (press) | nothing | Locks control to Lasso Selection |
http://www.dataplusscience.com/MapControlTips.html
Wednesday 22 June 2016
QGIS
1.menu de baixo trocar EPSG para WGS 84
2. calcular centroide - Select Polygon Centroids menu item Vector>Geometry Tools>Polygon Centroids e depois Export/Add Geometry (salva como novo shp)
https://cmapsconnect.com/tutorial/getting-shapefile-centroids-center-point/#gsc.tab=0
3. menu layer >open table attribute p ver coordenadas
4. menu layer > save layer as file (csv)
Wednesday 15 June 2016
Bend custom geocoding in Tableau
I press Ctrl + A to select all the marks on the map (or Area select them) and then right-click a mark and select “View Data”.
Now I have every zip code within a region along with the associated Latitude and Longitude. Now, simply press Ctrl + A to select all rows, then Copy, then close the dialog box, then Ctrl + V to paste back into Tableau as a new data source!
http://vizpainter.com/poor-mans-custom-geocoding-in-tableau-part-2/
Tuesday 14 June 2016
Create parameter to change level of geographical level
Overlap 2 different layers (filled and shape) in tableau
Create a dual-axis map.
- Add one level of the hierarchy (for example, states) to the view by double-clicking the field in the Dimension pane. This will add the generated Latitude and Longitude fields onto the Column and Rows shelf.
- Add an additional instance of Latitude (generated) to the Rows shelf.
- Add the other desired level of the hierarchy (for example, city) to the Marks card for the second Latitude (generated) field.
- On the Rows shelf, right-click on the second Latitude (generated) field and select Dual Axis.
Numeric field in seconds to HH:MM:SS
[field in seconds]/(60*60*24)
format > custom> hh:mm:ss
https://community.tableau.com/message/224840
format > custom> hh:mm:ss
https://community.tableau.com/message/224840
Google Analytics Measures formulas in Tableau
http://kb.tableau.com/articles/knowledgebase/useful-ga-measures
| Group | Measures Name | Tableau Formula | Version |
|---|---|---|---|
| AdSense | AdSense CTR | [AdSense Ads Clicks]/[AdSense Page Impressions] | 8.2 and later |
| AdSense | AdSense eCPM | [AdSense Revenue]/[AdSense Page Impressions]*0.001 | 8.2 and later |
| AdWords | CPM | [Cost] / ([Impressions] / 1000) | 8.0 and later |
| AdWords | CPC | [Cost] / [Clicks] | 8.0 and later |
| AdWords | CTR | [Clicks] / [Impressions] | 8.0 and later |
| AdWords | Cost per Transaction | [Cost] / [Transactions] | 8.0 and later |
| AdWords | Cost per Goal | [Cost] / [Goal Completions] | 8.0 and later |
| AdWords | Cost per Conversion | [Cost] / ([Transactions] + [Goal Completions]) | 8.0 and later |
| AdWords | RPC | ([Revenue] + [Goal Value]) / [Clicks] | 8.0 and later |
| AdWords | ROI | ([Revenue] + [Goal Value] - [Cost]) / [Cost] | 8.0 and later |
| AdWords | Margin | ([Revenue] + [Goal Value] - [Cost]) / ([Revenue] + [Goal Value]) | 8.0 and later |
| App Tracking | Screens / Sessions | [Screen Views]/[Visits] | 8.2 |
| App Tracking | Screens / Sessions | [Screen Views]/[Sessions] | 8.2.1 and later |
| Ecommerce | Ecommerce Conversion Rate | [Transactions] / [Visits] | 8.0 – 8.2 |
| Ecommerce | Ecommerce Conversion Rate | [Transactions] / [Sessions] | 8.2.1 and later |
| Ecommerce | Avg. Value | [Revenue] / [Transactions] | 8.0 and later |
| Ecommerce | Per Visit Value | [Revenue] / [Visits] | 8.0 – 8.2 |
| Ecommerce | Per Session Value | [Revenue] / [Sessions] | 8.2.1 and later |
| Ecommerce | Total Value | [Revenue] + [Goal Value] | 8.0 and later |
| Ecommerce | Revenue per Item | [Product Revenue] / [Quantity] | 8.0 and later |
| Ecommerce | Items per Purchase | [Quantity] / [Unique Purchases] | 8.0 and later |
| Event Tracking | Avg. Value | [Event Value] / [Total Events] | 8.0 and later |
| Event Tracking | Events per Visit with Event | [Total Events] / [Visits with Event] | 8.0 – 8.2 |
| Event Tracking | Events per Session with Event | [Total Events] / [Sessions with Event] | 8.2.1 and later |
| Exceptions | Exceptions / Screen | [Exceptions]/[Screen Views] | 8.2 and later |
| Exceptions | Crashes / Screen | [Fatal Exceptions]/[Screen Views] | 8.2 and later |
| Goal Conversions | Per Visit Goal Value | [Goal Value] / [Visits] | 8.0 – 8.2 |
| Goal Conversions | Per Session Goal Value | [Goal Value] / [Sessions] | 8.2.1 and later |
| Goal Conversions | Goal Conversion Rate | [Goal Completions] / [Visits] | 8.0 – 8.2 |
| Goal Conversions | Goal Conversion Rate | [Goal Completions] / [Sessions] | 8.2.1 and later |
| Goal Conversions | Abandoned Funnels | [Goal Starts] - [Goal Completions] | 8.0 and later |
| Goal Conversions | Total Abandonment Rate | ([Goal Starts] - [Goal Completions]) / [Goal Starts] | 8.0 and later |
| Internal Search | Avg. Search Results Views | [Search Result Views] / [Total Unique Searches] | 8.0 and later |
| Internal Search | % Visits with Search | [Visits with Search] / [Visits] | 8.0 – 8.2 |
| Internal Search | % Sessions with Search | [Sessions with Search] / [Sessions] | 8.2.1 and later |
| Internal Search | Avg. Search Depth | [Search Depth] / [Total Unique Searches] | 8.0 and later |
| Internal Search | Avg. Search Duration | [Time after Search] / [Total Unique Searches] | 8.0 and later |
| Internal Search | % Search Exits | [Search Exits] / [Total Unique Searches] | 8.0 and later |
| Internal Search | Search Goal Conversion Rate | [Goal Completions] / [Total Unique Searches] | 8.0 and later |
| Internal Search | Goal Value per Search | [Goal Value] / [Total Unique Searches] | 8.0 and later |
| Other | App Views per Visit | [App Views] / [Visits] | 8.0 – 8.2 |
| Other | App Views per Session | [App Views] / [Sessions] | 8.2.1 and later |
| Other | Avg. Visit Duration | [Visit Duration] / [Visits] | 8.0 – 8.2 |
| Other | Avg. Session Duration | [Session Duration] / [Sessions] | 8.2.1 and later |
| Other | Actions per Social Visit | [Social Actions / [Unique Social Actions] | 8.0 – 8.2 |
| Other | Actions per Social Session | [Social Actions / [Unique Social Actions] | 8.2.1 and later |
| Other | Avg. User Timing (sec) | [User Timing (ms)] / [User Timing Sample] | 8.0 and later |
| Other | % New Visits | [New Visits] / [Visits] | 8.0 – 8.2 |
| Other | % New Sessions | [New Sessions] / [Sessions] | 8.2.1 and later |
| Page Tracking | Entrances/Pageviews | [Entrances] / [Pageviews] | 8.0 and later |
| Page Tracking | Entrance Bounce Rate | [Bounces] / [Entrances] | 8.0 and later |
| Page Tracking | Bounce Rate | [Bounces] / [Visits] | 8.0 – 8.2 |
| Page Tracking | Bounce Rate | [Bounces] / [Sessions] | 8.2.1 and later |
| Page Tracking | Pages/Visit | [Pageviews] / [Visits] | 8.0 – 8.2 |
| Page Tracking | Pages/Session | [Pageviews] / [Sessions] | 8.2.1 and later |
| Page Tracking | Avg. Time on Page | [Time on Page] / ([Pageviews] - [Exits]) | 8.0 and later |
| Page Tracking | % Exit | [Exits] / [Pageviews] | 8.0 and later |
| Page Tracking | Avg. Page Load Time | ([Page Load Time] / [Page Load Sample]) * 0.001 | 8.0 and later |
| Site Speed Avg. | Avg. Document Content Loaded Time (sec) | ([Document Content Loaded Time (ms)]/[DOM Latency Metrics Sample])*0.001 | 8.2 and later |
| Site Speed Avg. | Avg. Document Interactive Time (sec) | ([Document Interactive Time (ms)] / [DOM Latency Metrics Sample])*0.001 | 8.2 and later |
| Site Speed Avg. | Domain Lookup Time | ([Domain Lookup Time] / [Speed Metrics Count]) * 0.001 | 8.0 and later |
| Site Speed Avg. | Page Download Time | ([Page Download Time] / [Speed Metrics Count]) * 0.001 | 8.0 and later |
| Site Speed Avg. | Redirection Time | ([Redirection Time] / [Speed Metrics Count]) * 0.001 | 8.0 and later |
| Site Speed Avg. | Server Connection Time | ([Server Connection Time] / [Speed Metrics Count]) * 0.001 | 8.0 and later |
| Site Speed Avg. | Server Response Time | ([Server Response Time] / [Speed Metrics Count]) * 0.001 | 8.0 and later |
Monday 13 June 2016
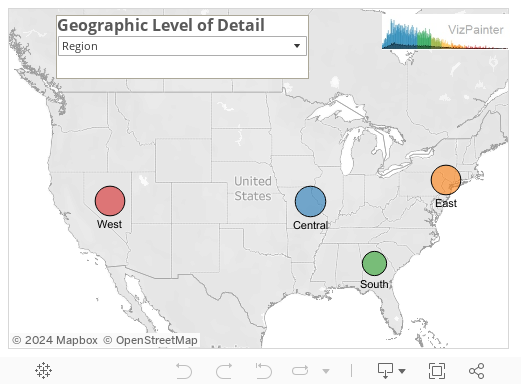
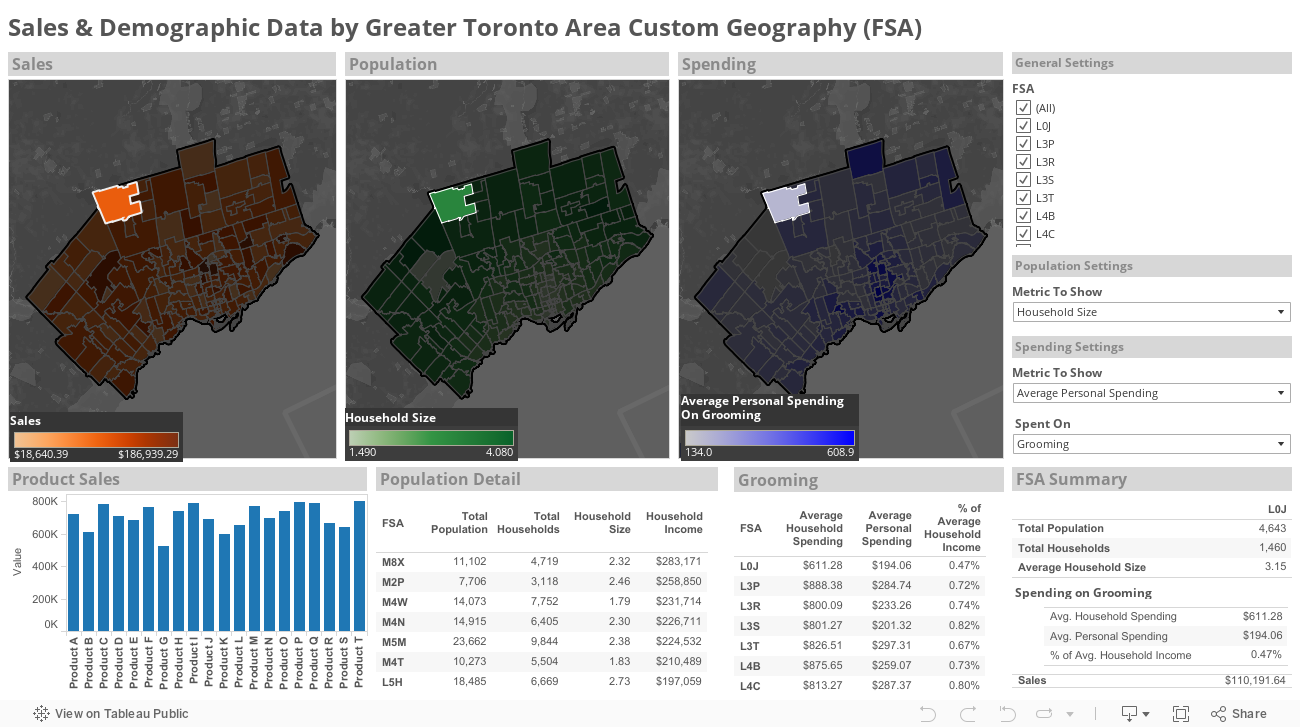
Custom Mapping (FSA)
http://public.tableau.com/views/CustomGeocoding/SalesDemographicsDashboard?:embed=y&:showVizHome=no&utm_medium=Website&utm_source=Unilytics&utm_campaign=Link+Cust+Dash+wp&utm_content=:&UC.cid=WUCDgeocode&WT.mc_id=WUCDgeocode
Thursday 9 June 2016
hh:mm:ss to seconds in Tableau
The DATEPART() function is used in the # of Seconds calc to extract the hours, minutes, and seconds to turn everything into seconds with the following formula:
https://community.tableau.com/message/224840
DATEPART('hour',[Time DateTime]) * 3600 + DATEPART('minute',[Time DateTime])*60 + DATEPART('second',[Time DateTime])
Now there's a measure that can be used. To go from # of Seconds back to HH:MM:SS, here's a hh:mm:ss string calc with the following formula:
STR(INT(SUM( [# of Seconds] )/3600)) + ":" +
// convert minutes back to a string
IF LEN(STR(INT((SUM([# of Seconds]) % 3600 ) / 60))) = 1 THEN
"0" + STR(INT((SUM([# of Seconds]) % 3600 ) / 60))
ELSE
STR(INT((SUM([# of Seconds]) % 3600 ) / 60))
END
IF LEN(STR(INT((SUM([# of Seconds]) % 3600 ) / 60))) = 1 THEN
"0" + STR(INT((SUM([# of Seconds]) % 3600 ) / 60))
ELSE
STR(INT((SUM([# of Seconds]) % 3600 ) / 60))
END
+ ":" +
//convert seconds back to a string
IF LEN(STR(INT(SUM([# of Seconds]) % 60))) = 1 THEN
"0" + STR(INT(SUM([# of Seconds]) % 60))
ELSE
STR(INT(SUM([# of Seconds]) % 60))
END
"0" + STR(INT(SUM([# of Seconds]) % 60))
ELSE
STR(INT(SUM([# of Seconds]) % 60))
END
https://community.tableau.com/message/224840
Transform string date to date format in Tableau
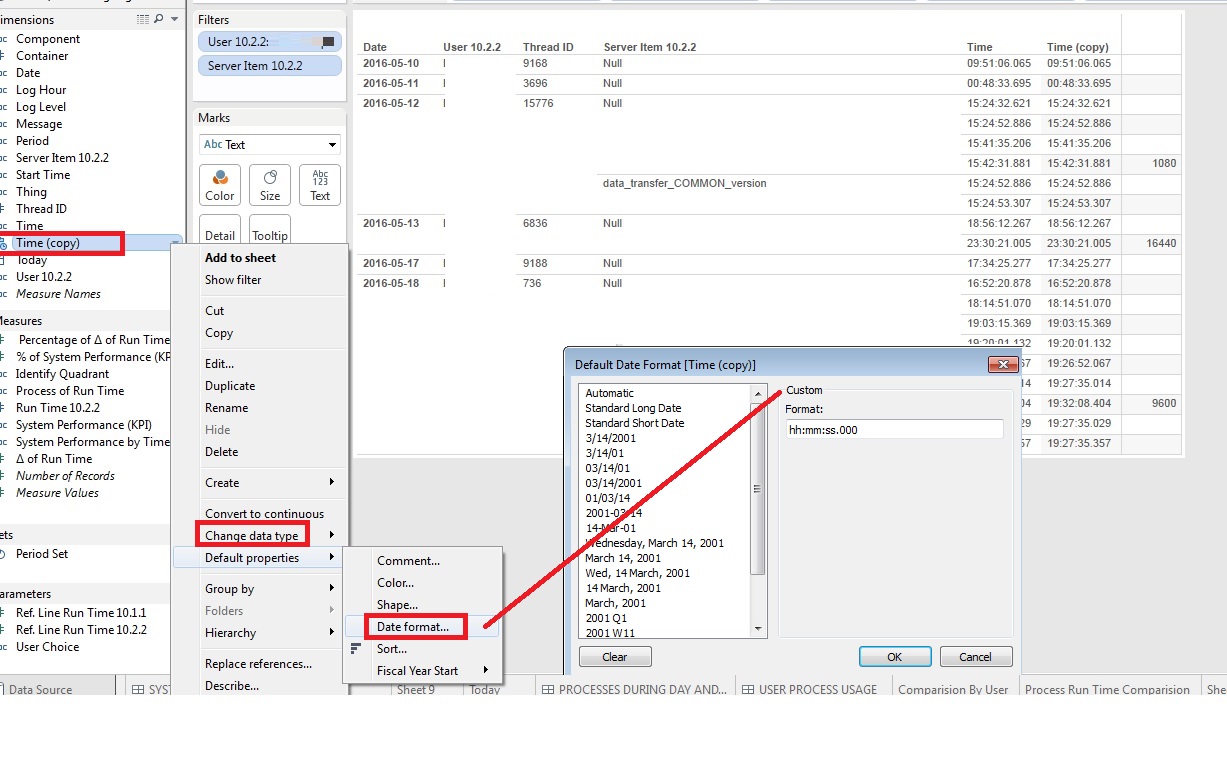
1. Duplicate the date dimesion (string)
2. Right click and "Change date type">>>> Date & Time >> Ok
3. Right click and "Default Properties">>>> Date Format >> Custom >>> add "hh:mm:ss.000"
Wednesday 8 June 2016
Adding dynamic reference line for each separate member in a dimension
Step 1: Create the parameters
- Right-click in the Data pane and then select Create Parameter.
- In the Create Parameter dialog box, name the parameter "Furniture Goal".
- Under Data Type select Integer.
- Under Allowable values select All.
- Click OK.
- Right-click the parameter and then select Show Parameter Control.
- Complete Steps 1 through 6 for a parameter named "Office Supplies Goal".
- Complete Steps 1 through 6 for a parameter named "Technology Goal".
Step 32 Create the calculated field
- Select Analysis > Create Calculated Field.
- In the Create Calculated Field dialog box, name the field "Reference Line".
- In the formula field, enter the following formula:
CASE MIN([Department])
WHEN 'Furniture' THEN MIN([Furniture Goal])
WHEN 'Office Supplies' THEN MIN([Office Supplies Goal])
WHEN 'Technology' THEN MIN([Technology Goal])
END
- Click OK.
http://kb.tableau.com/articles/howto/adding-separate-dynamic-reference-lines-for-each-dimension-member
Tuesday 7 June 2016
Create Quadrant in Tableau + Dynamic Reference Lines and Colors in Scatter Plots
http://kb.tableau.com/articles/knowledgebase/create-quadrant-chart
Dynamic Reference Lines and Colors in Scatter Plots
http://www.thedataschool.co.uk/pablo-saenz-de-tejada-2-2-2-2-2-2-2-2-2-2-2-2/dynamic-reference-lines-and-colors-in-scatter-plots/
Dynamic Reference Lines and Colors in Scatter Plots
http://www.thedataschool.co.uk/pablo-saenz-de-tejada-2-2-2-2-2-2-2-2-2-2-2-2/dynamic-reference-lines-and-colors-in-scatter-plots/
Monday 6 June 2016
Asterisks Display in Tooltips - Tableau Desktop
http://kb.tableau.com/articles/Issue/asterisks-display-in-tooltip?userSource=1
https://community.tableau.com/thread/153244?start=30&tstart=0
Problem: I was
able to display the multiples time in a single row, but as tooltip it is
duplicating the values
Feeder (Table across)
used:
IF first()==0 THEN
STR(min([Start
Timestamp]))ELSE
PREVIOUS_VALUE("") + ", " + STR(min([Start Timestamp]))
END
Date tooltip (Table across) used:
IF FIRST()==0 THEN
LOOKUP([Feeder],LAST())END
Table Calculation Functions
Filter Actions
Connecting Active Directory as Tableau data source
The ability to connect with Active Directory as a data source is not currently built into Tableau desktop.
The best practice to get
around this issue is to mirror the unsupported data source onto a support data
source, so you can place the data you want to analyze in a form that Tableau
Desktop can properly connect with. The article below goes into more detail on
this issue and using an ODBC connection:
'Connections to Unsupported Data Sources'
'Ideas'
LDAP (OLE DB/ADO) data connector for analytics
Friday 3 June 2016
Viz with data from Google Analytics
https://public.tableau.com/profile/nomie#!/vizhome/Q1-GoogleAnalytics-Analysis/Sheet3
https://public.tableau.com/views/DigitalAnalytics/ReferralSourceTypes?%3Aembed=y&%3AshowVizHome=no

http://vizwiz.blogspot.ca/2014_12_01_archive.html
 http://dataremixed.com/2013/08/how-to-view-your-website-stats-in-tableau/
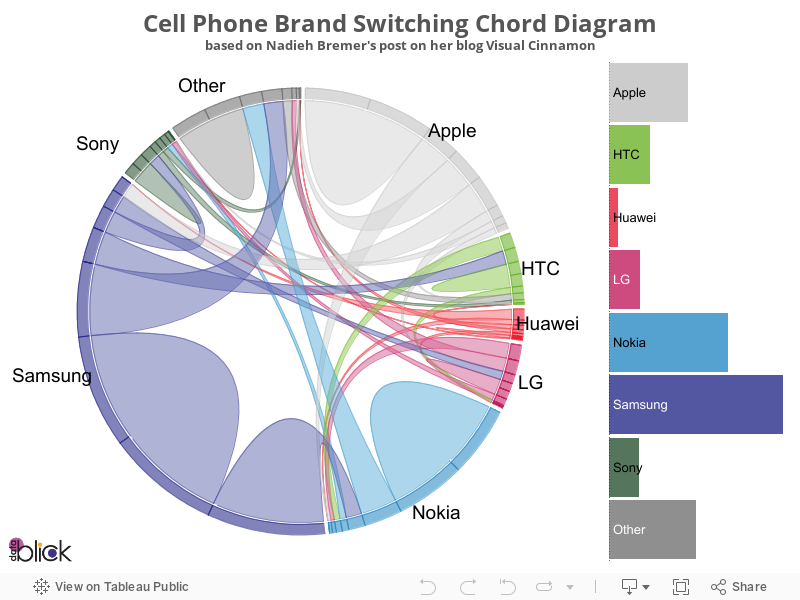
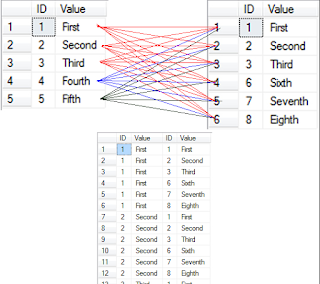
Chord Diagram in Tableau
Tuesday 31 May 2016
Swapping views by categories (parameters) - Filtering a view according to a category selection (filter)
filtering a view according to a category selection:
Option 1- Using Filter Shelf Selection
1. Locate the field that the view would be filtered by,
in this case it would be Category 2. Drag this field, Category, onto the Filter
Shelf 3. Right-click the field in the Filter Shelf and select "Show
Filter"
4. Select the number of Categories that will affect the
view 5. If desired the selection box can be formatted to show different
selection methods by right-clicking the box
Option 2- Using a Parameter
1. Create a new Parameter
2. Select String for Data type
3. Select List
4. From 'Add from Field'
select the desired field, in this case Category 5. Select Ok 5. Drag the
field selected above, Category, onto the Filter Shelf 6. Select Use all on the
General Tab 7. Move to the Condition Tab 8. Select 'By formula' and type the
following
[Category]=[Parameter Created Above]
9. Click ok
10. Right-click the parameter from the left hand pane and
select 'Show Parameter'
Using any of the two options above will allow for the
selection of a category to filter the current view. Please see the following
articles for further information on filtering a view:
Show Filters in the View
Changing Views Using Parameters
Filters Shelf
Friday 27 May 2016
Subscribe to:
Posts (Atom)